|
5 min read
Protect your reputation: use an observability platform
Protect your reputation: use an observability platform

Why you should be using an observability platform
It pays to be observant, especially if you are running a 24 hour online business. By using an observability platform, you can reduce downtime and improve performance of your websites and applications while protecting your business’ reputation.
Too often, website performance and downtime are seen as the exclusive domain of the IT department. But the reality is that if your website is underperforming, it’s not just a problem for the tech department – it affects the entire business.
Consider the cost of site downtime. For an eCommerce site, it could obviously mean lost sales, but the implications go far beyond that – for virtually any type of business, site downtime could mean missing out on new leads and registrations, and it could also mean lost productivity, as countless hours are spent resolving the problem and clearing a backlog of customer support requests.
Consider, too, the damage to how your brand is perceived, and your relationship with your customers. The typical consumer won’t hesitate to go to another site to find what they’re after if yours is down or running slowly, and if they come to expect problems every time they visit your site, how long do you think they’ll keep visiting?

OK - you might let Github off once for a site error when you get to see their cute error page, but hopefully they know you have seen this and will work out why it has occurred before it becomes a bigger problem.
It’s not just people you need to worry about, either. If your site is down when GoogleBot indexes it, it could result in a temporary drop in your Google rankings – and if your site is down frequently or for long periods of time, it could result in Google dropping your site from its index, a catastrophic setback to your SEO efforts. Even if your site is almost always up, running slowly will send you tumbling down the Google search rankings.
Of course, even the most attentive business owner can’t be personally watching their websites and applications 24/7, and you can’t rely on your customers to tell you when something’s wrong – because by the time one of them does, you can rest assured that you’ve lost others who simply took their business elsewhere.
You need to be proactively monitoring the health of your web presence – but with so many things that can go wrong with today’s complex, distributed systems, it’s difficult, if not outright impossible, to know where to look for broken links in the chain.
That’s where an observability platform comes in, and why having one is so crucial to your business.
What is an observability platform?
In February 2002, then US Secretary of Defence Donald Rumsfeld was widely lampooned for a statement that most people thought was sheer nonsense: “There are known knowns. There are things we know that we know. There are known unknowns. That is to say, there are things that we now know we don’t know. But there are also unknown unknowns. There are things we do not know we don’t know.”
Ask any software engineer today, however, and they’ll be able to tell you exactly what Rumsfeld was on about with his “unknown unknowns”. Traditional monitoring platforms for older technologies watched for known problems, as those systems tended to fail in the same ways over and over again.
But today’s increasingly complex systems – cloud-native microservices, serverless computing, DevOps, site reliability engineering (SRE) and so on – don’t just give developers more functionality; they also exponentially increase the number of potential issues and errors that can arise.
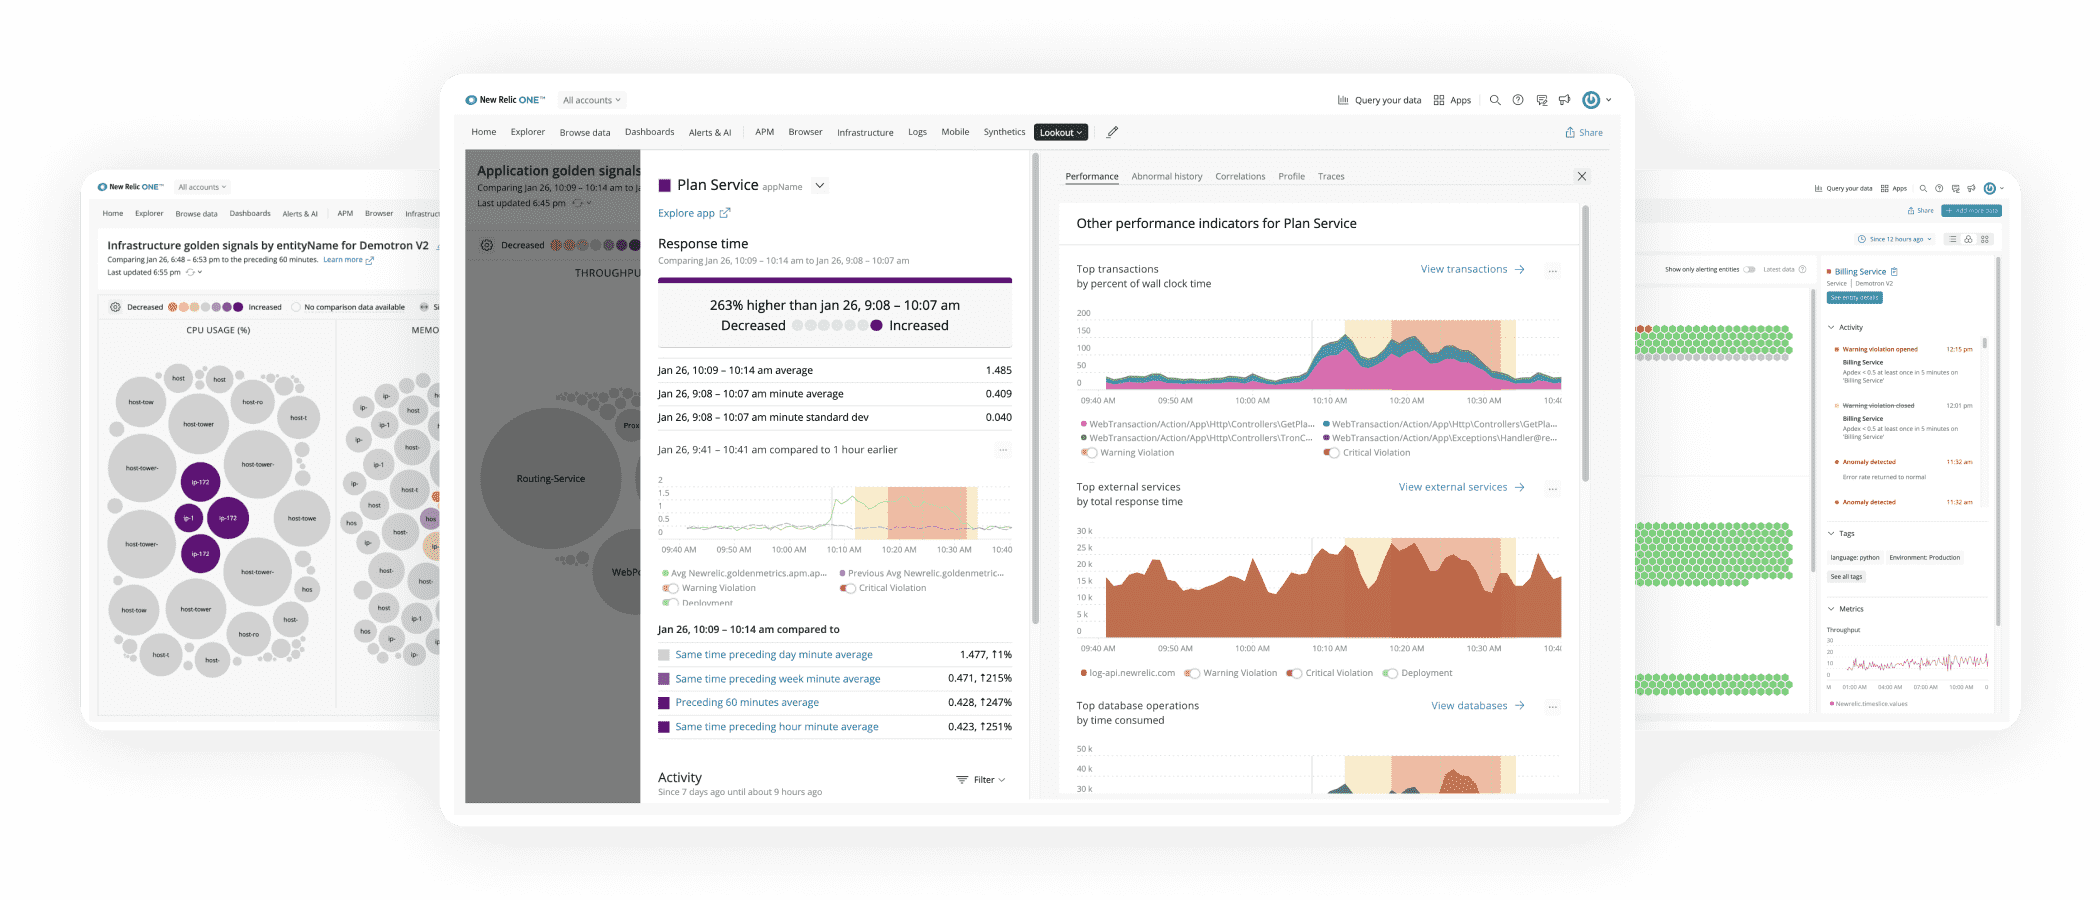
Rather than simply monitoring for known problems, an observability platform gives you the instrumentation you need to collect and correlate complete telemetry data so you can understand your digital systems better.
In other words, ‘observability’ isn’t just a synonym for monitoring. As Yuri Shkuro, software engineer at Uber Technologies, has explained, monitoring is about measuring what you already knew was important, whereas observability is about having the ability to ask questions that you didn’t already know you’d need the answer to – the unknown unknowns.
This starts with log files – application logs, system logs, security logs and other log types that document every activity, or ‘event’, on your system. An observability platform will then cross-reference log files with metrics – measurements of performance, including the amount of processing power an application is using – and traces, which provide insight into transaction times and the flow of requests through the system, to yield actionable insights into system performance.
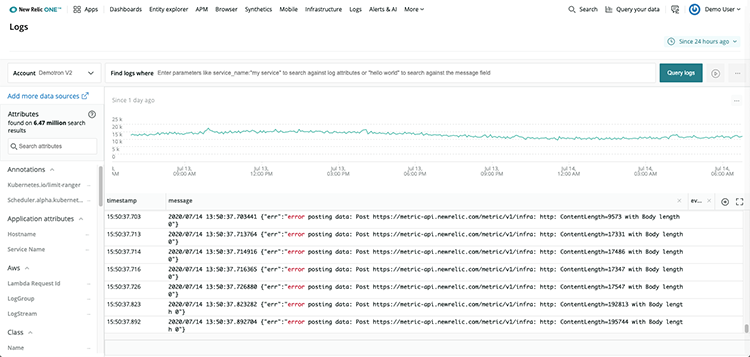
Not one of ours, but by amalgamating all their logs into one platform you get clear visibility of what is occurring across your distributed application. In this instance, they should have been alerted once the frequency of errors hit a certain number within a short time frame so they could address the problem. It does take a bit of time to work out what alerts should be put in place – the first step is to start recording the data so you can understand the patterns.
The observability platform then acts as a single source of truth for all of this operational data. Rather than having to sift through log files, metrics and traces from all of your systems and servers individually, you can track them in one place, minimising complexity and allowing you to view the big picture at a glance, with meaningful information and clear patterns to assist with error resolution and performance optimisation.
On a typical website we would include the standard IIS logs and an application logs created using log4net or NLog and these will be duplicated if their are multiple servers in a load balanced/scaled environment. Other related administrations or services can also be logged to the same centralised platform allowing all data to be viewed together - or individually with some basic filtering.
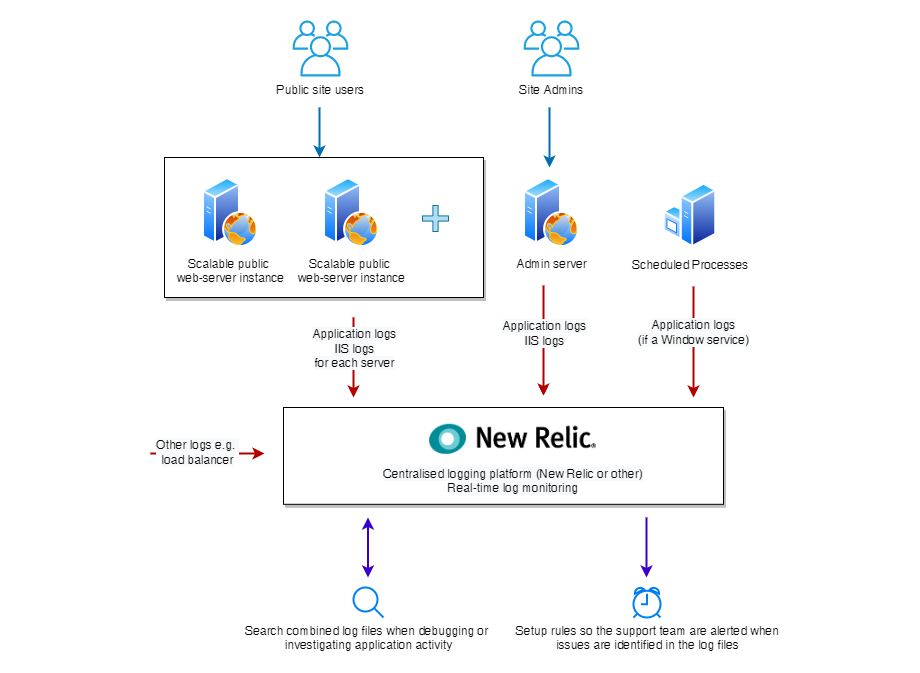
A typical setup for monitoring the log files for a scalable load balanced environment.
Once the logging is in place, you can use it for monitoring in real-time, investigating site issues and you can set up rules that trigger alerts if there is a problem occuring on the site.
The trigger for an alert would be a rule generally made up of two components, the log entry indicating a problem and how many times that entry appears over a time period. For instance with an IIS log, you could create an alert that is triggered when the logs show 10 instances of a 500 error in a minute. The options for how support staff are notified of the problem are many, from a simple email to integration with existing systems such as Slack, OpsGenie or other support platform that makes sure your team are aware of the problem.
How will my business benefit from using an observability platform?
An observability platform helps you to understand exactly what’s happening on your system and why it’s happening – but to what end?
First of all, observability helps developers to predict outages and problems before they occur and to swiftly detect, diagnose and resolve them when they do. The observability platform can be set up so that the anomalies and potential problems it detects – including increased latency (the delay between a user’s action and your application’s response), errors and high traffic – will trigger real-time failure warnings. This enables your business to be proactive and troubleshoot issues before your customers ever notice them.
As well as detecting technical difficulties within your system and errors caused by third-party applications, an observability platform can also detect potential security breaches and malicious attacks from external forces – a DDoS attack, for instance, or a high number of failed log-ins signalling a brute force attempt to gain access to your system.
But an observability platform isn’t just useful for warning you about potentially catastrophic errors. It can also be used to guide incremental improvements and tweaks to improve your site’s performance. An observability platform gives you access to real-time analytics and insights about user behaviours, network speed, system availability and capacity that you can use to optimise your resources and gain greater operating efficiency.
You could track what happens every time a request comes in to your site – how long the SQL database commands take to run, how fast your .NET or PHP code is running, how long it’s taking third-party APIs to respond, and how long it’s taking to render the page on the user’s web browser. This will enable you to see where the bottlenecks are, and make changes or improvements where necessary.
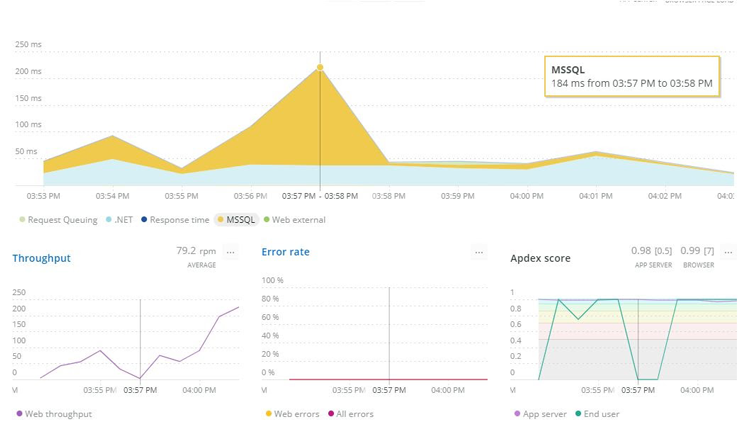
Looking into the performance of each stage of loading the page provides an insight into where time savings could be had to improve the page loading speed. Here you can see that SQL queries are sometimes delaying the page load and should be assessed. Viewing that SQL speed in context of the throughput also suggests that when the site gets less traffic, it responds slower. That only happens after a minute or so, and so the caching duration of data or page content should be adjusted.
Creating superior customer experiences online should help to generate revenue, but optimising your site’s performance can also save you money in unexpected ways. For instance, if you’re using less computing power to process each request that comes through your site, then you can assign more users to each of your servers, which will reduce your hosting costs.
There are a number of observability platforms on the market. We use New Relic at Zeroseven, but other options that provide all or some of the monitoring aspects described include Amazon CloudWatch, Azure Application Insights, Dynatrace, Sumo Logic, InfluxDB, Datadog, Grafana and Flowmill from Splunk. We’re not here to advocate for any one observability platform over another – what matters is that you’re using one, and you’re using it proactively.
After all, can you really afford not to?